How to Do Data Analysis in SEO
 Taha Yelkenci
SEO Consultant | · updated: 2020-01-25 | 3 min read

In SEO projects, whether the site is big or small, building strategies on data always produces better outcomes. So which data is actually useful in SEO? How do we collect it? Where and how do we read and interpret it?
First, crawl the whole site (I would suggest Screaming Frog) and collect every URL along with its page-level attributes. When we merge each page's summary with data from Google Analytics, Search Console, Screaming Frog, social networks, Ahrefs and Moz, we end up with tables that are ready to read. Excel or Google Sheets is fine for holding them.
Let's look at what each tool gives us:
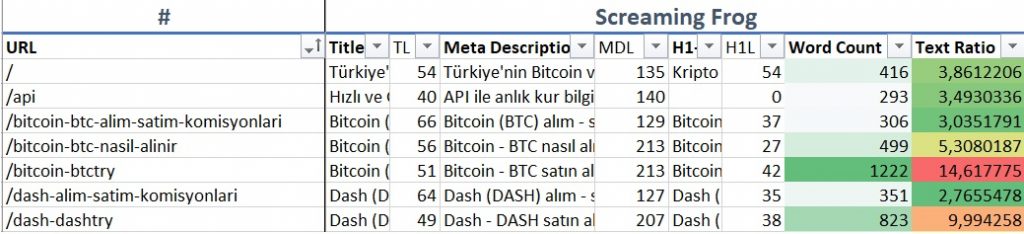
1 — With Screaming Frog we crawl the entire site and collect attributes such as title, description, H tags and text ratio for every page.
2 — With Google Analytics we list the pages that received organic traffic in the last three months, and collect data such as total traffic, page speed, bounce rate, time on page, number of conversions and conversion rate.

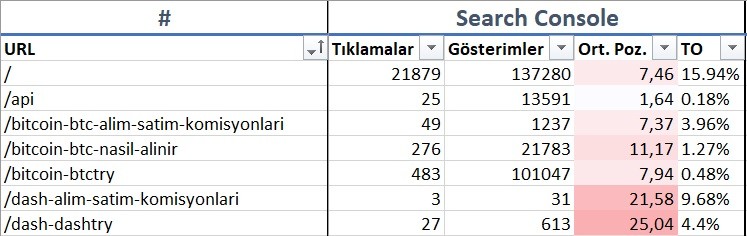
3 — With Search Console we list the pages that received organic traffic over the same period. I deliberately use the same date range as Analytics so the two sets line up. Here we collect clicks, impressions, average position and CTR.
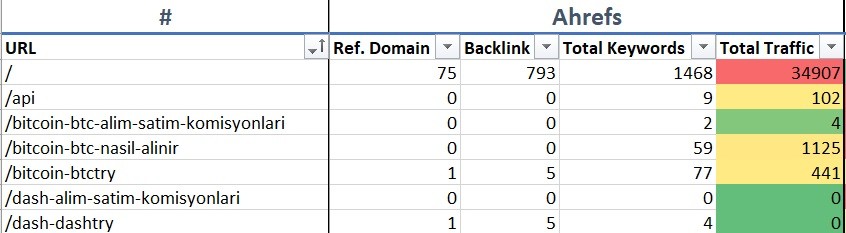
4 — With Ahrefs we list the values of every URL that appears across the data above, using Ahrefs' Batch Analysis tool. That gives us number of backlinks, number of keywords the page is visible for and total traffic.
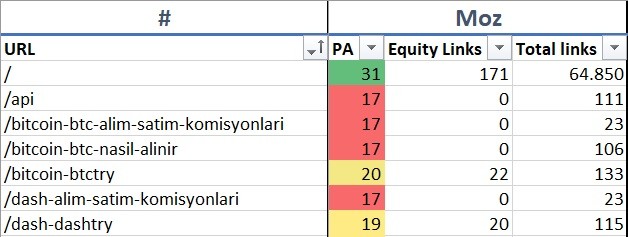
5 — With Moz we list the Page Authority of every page. You can substitute another tool's score here (Majestic, for instance).
6 — Finally we list our pages' visibility on social networks. SharedCount does the job: it tells us how many times each page was shared on Facebook, Pinterest and the rest.
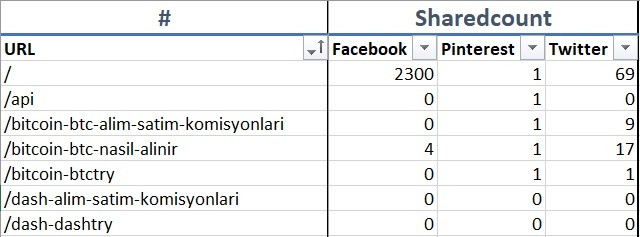
Merging everything we collected from those six tools into a single sheet produces a table like the one below.

Tip: on large sites (an e-commerce store, say) splitting the data into per-category sheets instead of one giant table makes it far easier to read and interpret.
Tip 2: to merge large data sets in Excel, look up the VLOOKUP formula.
Tip 3: to take this beyond Excel formulas, ZEO's article on SEO analysis with Python is worth reading.
Now the enjoyable part: how do we make sense of all this data?
From it we can derive a great many improvements across technical, content and backlinks. With some imagination and sensible filtering, new strategies fall out of the sheet.
A few examples to get you started:
- List the pages with high organic traffic and a high bounce rate. Does their content answer the user's query? Does it meet the user's intent? There is a content strategy hiding in that list.
- List the pages with high organic traffic and poor page speed, and work on their performance.
- List the pages ranking between positions 5 and 15 with no backlinks at all. If they rank there with no links, link building can lift their visibility.
- List the pages in the top 3 positions with a low click-through rate. There is work to do on titles, descriptions or structured data.
- List the pages shared heavily on social but receiving no organic traffic. If people like them yet they get no visits, they may be targeting irrelevant keywords — a content fix.
- List the pages with a high conversion rate but low organic traffic and low backlink value.
- Add AdWords data to the same sheet and list the pages with a high conversion rate but low organic traffic, then work on bringing more organic traffic to them.
Filtering many metrics at once like this is where imagination pays off.
Finally, I am sharing the spreadsheet shown in the screenshots above via Google Sheets. Anyone who wants to inspect or use it can grab it there.
Taha Yelkenci
SEO since 2010. Founder of rankZup. Got a question? Write to me →
← Previous post
Mobile Conversion Rate and Its Relationship with SEO
Next post →
The Most Common SEO Mistakes and How to Fix Them [Video]